Q1Multiple answers
Which statement(s) are correct about the Factorial Plot shown here? (Note: There are 3 correct answers).
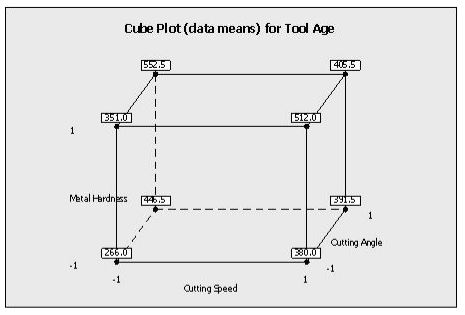
Which statement(s) are correct about the Factorial Plot shown here? (Note: There are 3 correct answers).
When conducting a Hypothesis Test using Continuous Data the proper sample size is influenced only by the extent to which we need to assess a Difference to be detected but not the inherent variation in the process.
Use this data to calculate the Z Score. Average of: 92, Standard Deviation: 2, Upper Spec Limit: 101
Which of these graphs demonstrates conditions which would be sufficient to enable OCAP for the process?
Fractional Factorial Designs are used to analyze factors to model the output as a function of inputs if Hypothesis Testing in the Analyze Phase was inadequate to sufficiently narrow the factors that significantly impact the output(s).
Assessing process proportion as opposed to evaluating a process with respect to a set target can be done using one or more of these. (Note: There are 2 correct answers).
The _____________ Distribution would be the most desirable for modeling the number of stitch defects in a portion of fabric.
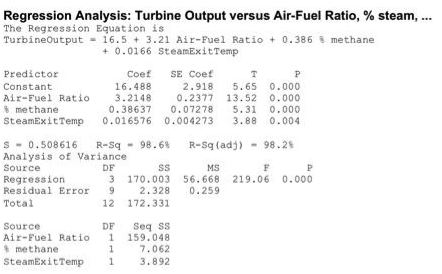
Which statement(s) are most correct for the Regression Analysis shown here?
When a Belt Poka-Yoke’s a defect out of the process entirely then she should track the activity with a robust SPC system on the characteristic of interest in the defect as an early warning system.
A valid mathematical Regression represents all of the characteristics shown except __________________.